Unifying fragmented analytics tools across a global consulting firm
BCG's internal analytics tools were fragmented and inconsistent across teams. I led product design to unify the experience — reducing time spent on data processing and analysis by 33%.
Year
2023
Client
Boston Consulting Group
Website
bcg.comContribution
Product Design — research, Double Diamond process, design system, and Cost Evaluation Tool.
Problem Statement
Internal analytics tools were fragmented across teams with inconsistent UX. Analysts spent significant time switching between apps, re-entering data, and reconciling results — instead of focusing on insights.
33%
reduction in data processing and analysis time
My Approach
I applied the Double Diamond framework — structured into Discovery and Delivery phases — to ensure every design decision was grounded in real user behaviour and technical constraints.
Inconsistent design language
Audited existing components and built a unified design system
Single source of truth adopted across 4 teams
No governance model
Defined contribution guidelines and review process
Reduced design debt by ~40% in 6 months
Scalability concerns
Tokenised spacing, colour, and typography
System scaled to 3 new product lines without rework
Distributed team
Created async-first documentation and Figma libraries
Onboarding time cut from 2 weeks to 3 days
Implementation gaps
Embedded with engineering for weekly design–dev syncs
Pixel-accuracy improved, fewer back-and-forth cycles
Research Phase
3 weeks of user interviews + 1 week of analysis. I shadowed analysts, observed workflows, and mapped four primary behaviour patterns.
01
Cost page inspection
Users spent disproportionate time validating cost data before any analysis could begin.
02
Cross-system comparison
Analysts regularly switched between 3–5 apps to compare data, introducing manual error.
03
Multi-app calculations
Correlated Index and Supplier Margin Cost required jumping between tools with no shared state.
04
Currency verification
Users had no reliable way to confirm data freshness — leading to decisions made on stale information.
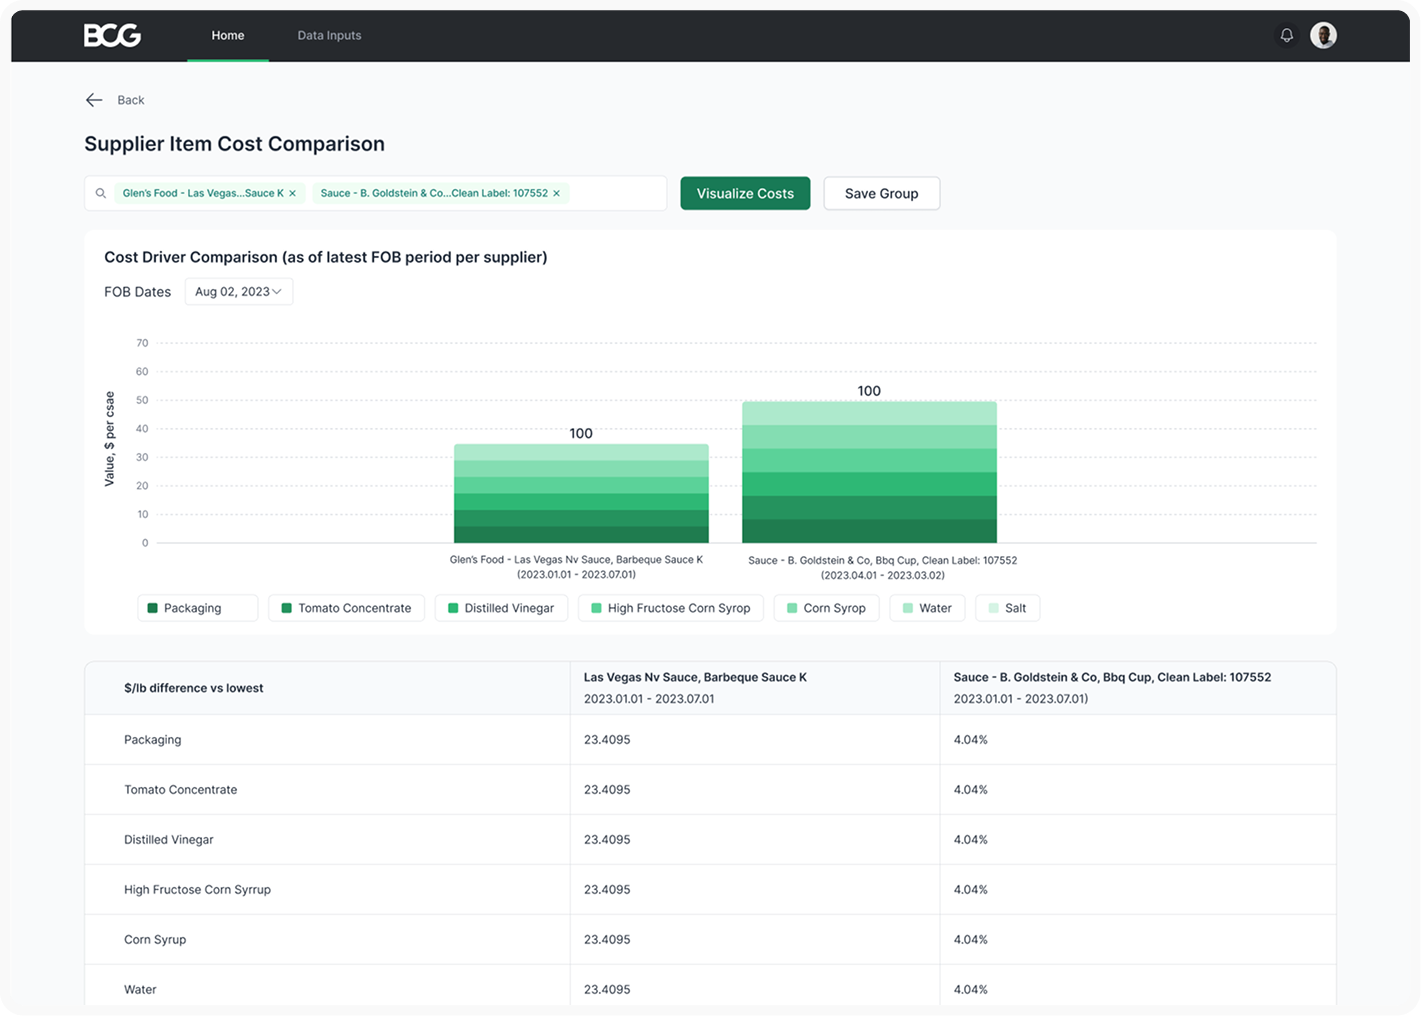
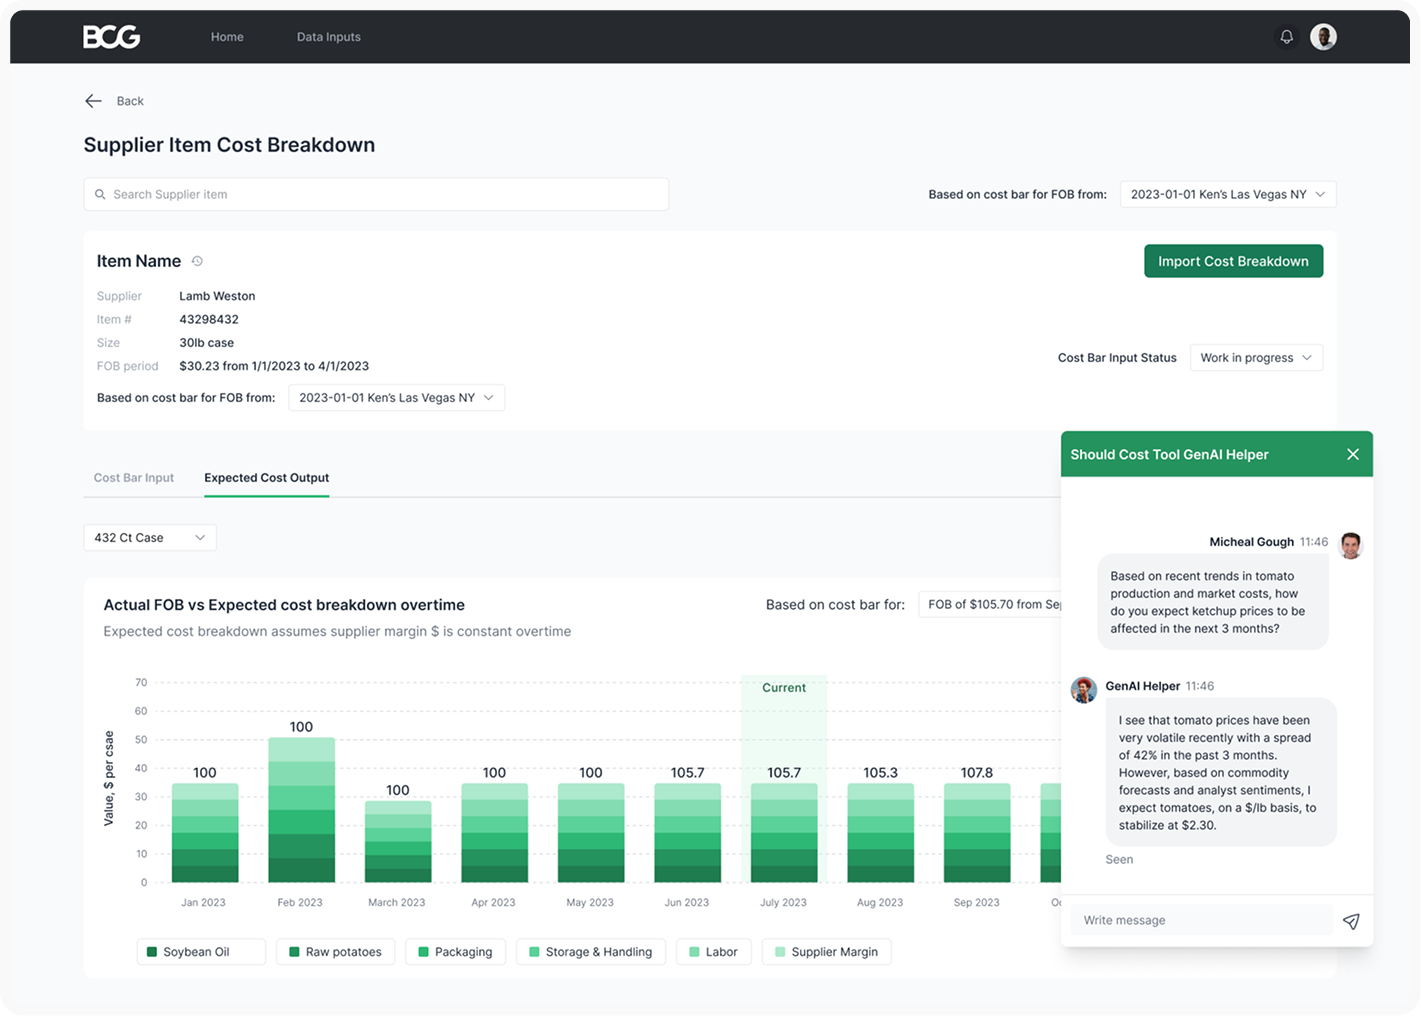
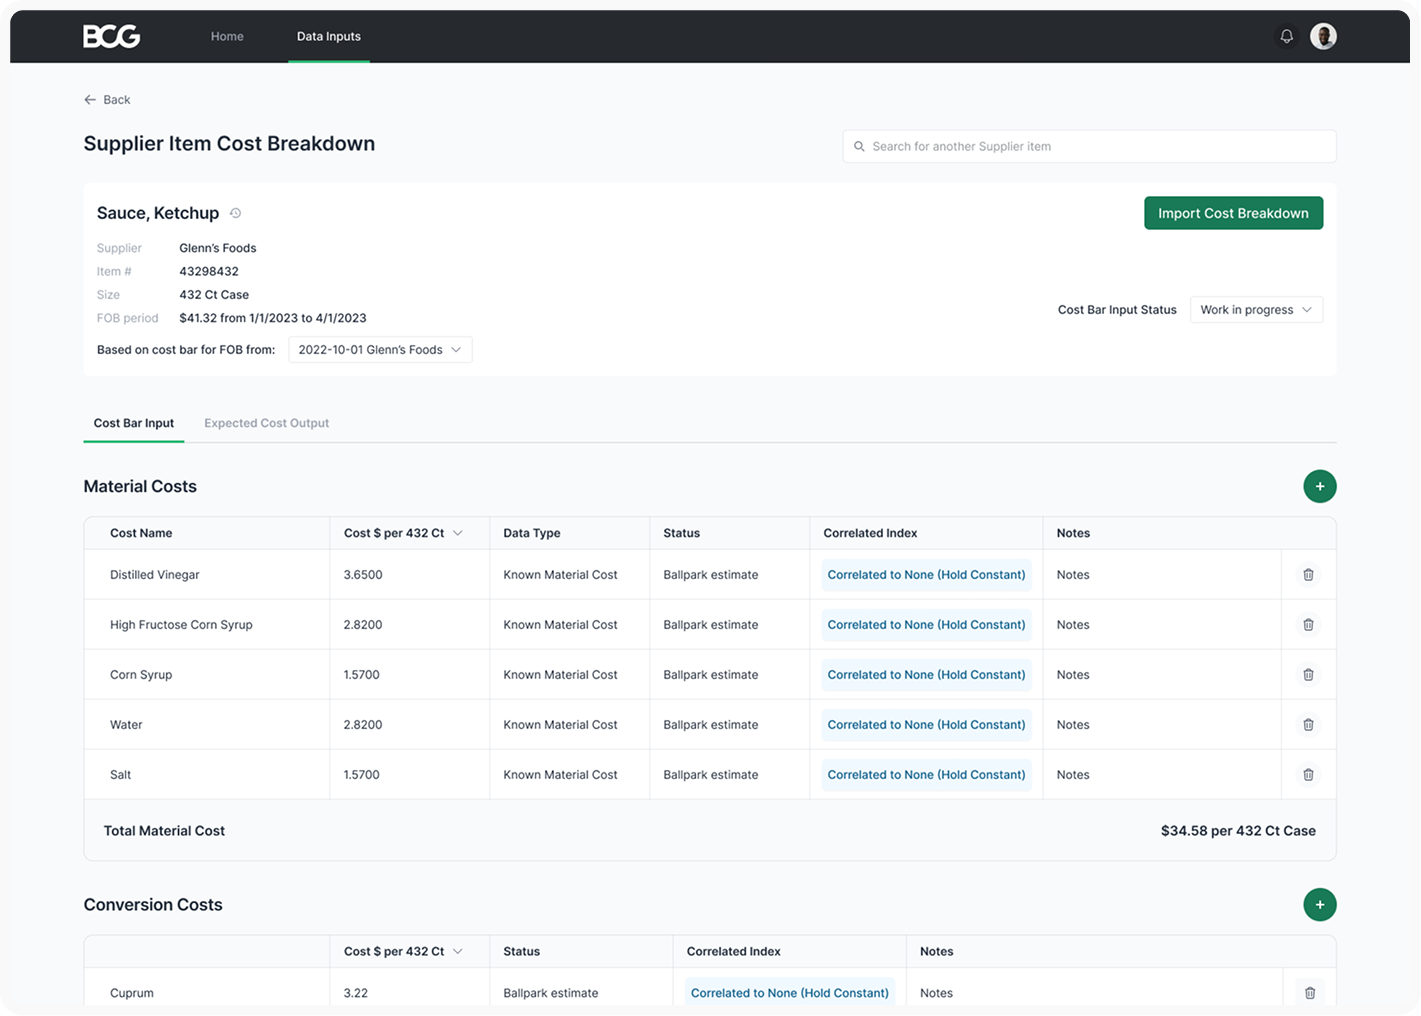
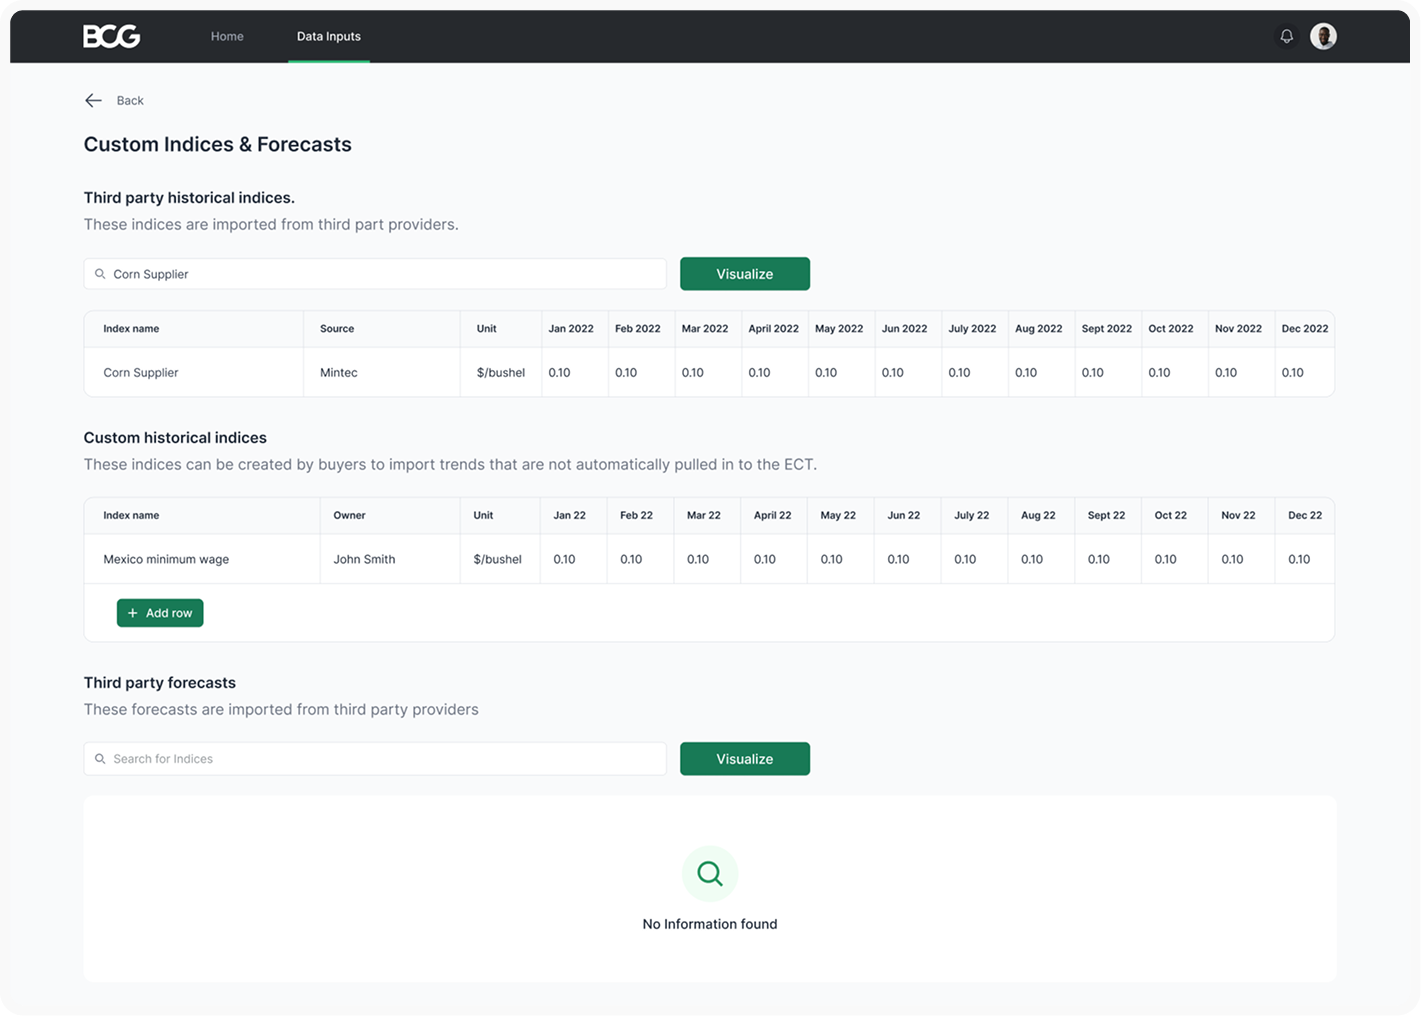
Final Solution
Cost Evaluation Tool (CET)
Using HMW frameworks and shadowing sessions, I designed the Cost Evaluation Tool — a unified interface that consolidated cost inspection, cross-system data comparison, and margin calculations into a single workflow.
The tool simplified investment evaluation and cost/revenue assessment, eliminating the need to switch between apps and reducing manual reconciliation entirely.
33%
Time saved on data processing
5→1
Apps consolidated into one
↓78%
Onboarding time reduced